You are here
Possible memory leak in NDB-API applications?
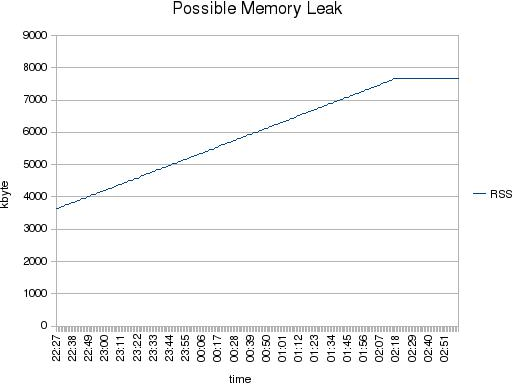
A customer has recently experienced a possible memory leak in its NDB-API application. What he did was something like:
# ps aux | grep <pid>
over time and then he saw the RSS increasing. When he would have had a look a little longer he would have seen that the RSS consumption would increase up to a certain level and then becomes stable. Which is the expected behavior.

But how to explain to the customer that his application, which was in fact not doing anything, consumes more RSS?
With a diff over time on /proc/<pid>/smaps we found that this area was the reason:
b67b7000-b6fca000 rw-p b67b7000 00:00 0 (8 Mbyte)
Size:               8268 kB
Rss:                 148 kB
Shared_Clean:          0 kB
Shared_Dirty:          0 kB
Private_Clean:         0 kB
Private_Dirty:       148 kB
Referenced:          148 kB
But what is this meaning? To find the answer we did a strace on the program and got the following system calls:
...
read(5, "127.0.0.1 localhost\n\n# The follo"..., 4096) = 450
close(5) = 0
munmap(0xb7acb000, 4096) = 0
mmap2(NULL, 2117632, PROT_READ|PROT_WRITE, MAP_PRIVATE|MAP_ANONYMOUS, -1, 0) = 0xb69bf000 - 0xB6BC4000 (2068 Mbyte)
mmap2(NULL, 2101248, PROT_READ|PROT_WRITE, MAP_PRIVATE|MAP_ANONYMOUS, -1, 0) = 0xb67be000 - 0xb69bf000 (2052 Mbyte)
mmap2(NULL, 32768, PROT_READ|PROT_WRITE, MAP_PRIVATE|MAP_ANONYMOUS, -1, 0) = 0xb7ac4000
mprotect(0xb7ac4000, 4096, PROT_NONE) = 0
clone(child_stack=0xb7acb4b4, flags=CLONE_VM|CLONE_FS|CLONE_FILES|CLONE_SIGHAND|CLONE_THREAD|CLONE_SYSVSEM|
      CLONE_SETTLS|CLONE_PARENT_SETTID|CLONE_C
...
OK. Somebody is allocating 2 times 2 chunks of about 2 Mbyte of memory. But what the hell could this be??? During night I found the solution. It is the SendBufferMemory and ReceiveBufferMemory which I have configured in the config.ini to that size...
When you experience similar behavior on your processes, maybe this little script can help you to find the problem: mem_tracker.sh (378 byte).
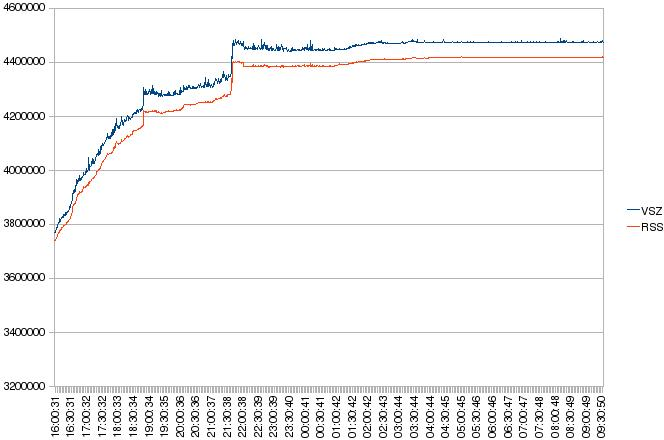
By the way, with an other customer we found some other nice behavior. But this time it was a mysqld:

- Shinguz's blog
- Log in or register to post comments
